
The Economic Dashboard
This dashboard provides an overview of the main indicators for each territory. The summary version is structured into three sections: economic outlook, cross-cutting markers, and priority sectors.
The “Economic Outlook” section illustrates trends in population growth and the labour market. The “Cross-Cutting Markers” section brings together indicators relating to the circular economy, biodiversity and access to information. The “Priority Sectors” section covers Sustainable Tourism, the Blue Economy, Connectivity, Energy and Construction, as well as territorial vulnerability.
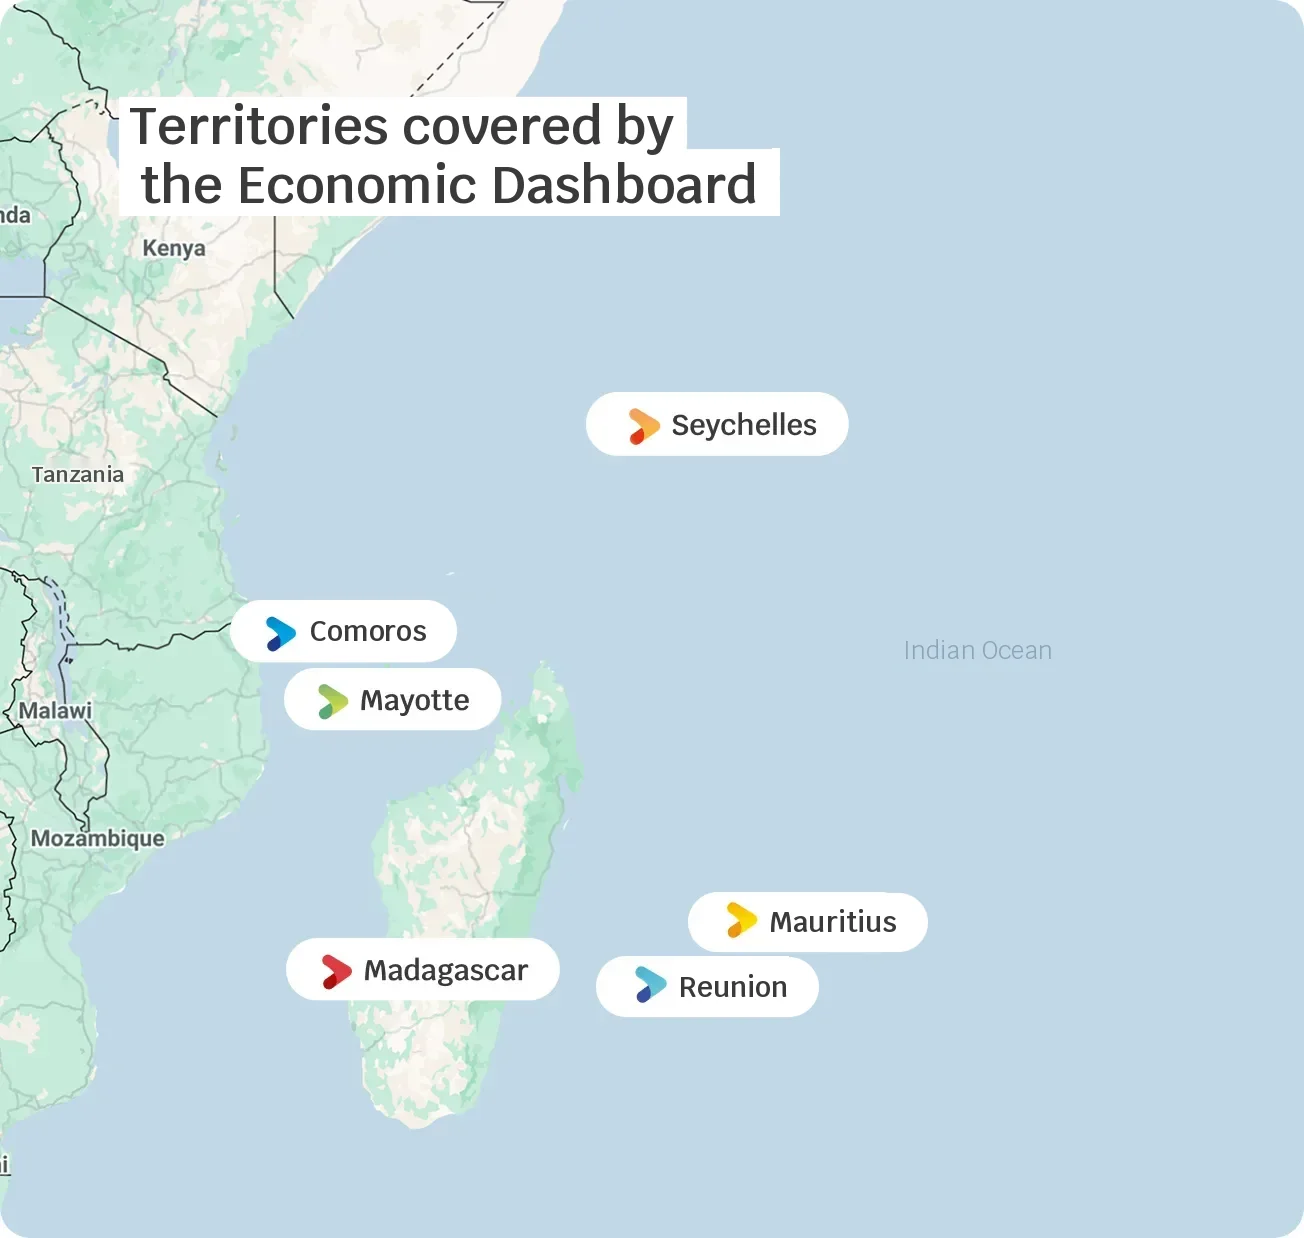
Data by Territory
Filter
Comoros
GDP structure (2021)
GDP Agriculture
GDP Industry
GDP Service
GDP per capita : 1 784,12 (2024)
Unemployment rate : 3,88 (2024)
Gini index : 45,30 (2024)
Greenhouse gas emissions : 0,75 (2022)
Tonnes of waste recycled : 6 680,66 (2024)
Population growth (%)
Labour market dynamics
Employment rate % (Male)
Employment rate % (Female)
Unemployment rate
Youth labour force participation rate (%)
GDP structure over time
GDP Agriculture
GDP Industry
GDP Service
Circular economy (tonnes)
Domestic Extraction
Domestic Material Input
Domestic Material Consumption
Resources Productivity
Protected terrestrial areas (km²)
Eco-certified accommodation
No data
Renewable energy consumption (%)
Fishery production (tonnes)
Effective marine protected areas (km²)
Container volume handled per year (units)
Digital coverage, at least 4G (%)
Maritime connectivity index
Remoteness index
Cereal import dependency (%)
Madagascar
GDP structure (2024)
GDP Agriculture
GDP Industry
GDP Service
GDP per capita : 549,64 (2024)
Unemployment rate : 3,01 (2024)
Gini index : 36,80 (2024)
Greenhouse gas emissions : 43,45 (2022)
Tonnes of waste recycled : 313 047,91 (2024)
Population growth (%)
Labour market dynamics
Employment rate % (Male)
Employment rate % (Female)
Unemployment rate
Youth labour force participation rate (%)
GDP structure over time
GDP Agriculture
GDP Industry
GDP Service
Circular economy (tonnes)
Domestic Extraction
Domestic Material Input
Domestic Material Consumption
Resources Productivity
Protected terrestrial areas (km²)
Eco-certified accommodation
Renewable energy consumption (%)
Fishery production (tonnes)
Effective marine protected areas (km²)
Container volume handled per year (units)
Digital coverage, at least 4G (%)
Maritime connectivity index
Remoteness index
No data
Cereal import dependency (%)
Mauritius
GDP structure (2024)
GDP Agriculture
GDP Industry
GDP Service
GDP per capita : 12 005,75 (2024)
Unemployment rate : 5,48 (2024)
Gini index : 36,80 (2024)
Greenhouse gas emissions : 6,81 (2022)
Tonnes of waste recycled : 28 502,72 (2024)
Population growth (%)
Labour market dynamics
Employment rate % (Male)
Employment rate % (Female)
Unemployment rate
Youth labour force participation rate (%)
GDP structure over time
GDP Agriculture
GDP Industry
GDP Service
Circular economy (tonnes)
Domestic Extraction
Domestic Material Input
Domestic Material Consumption
Resources Productivity
Protected terrestrial areas (km²)
Eco-certified accommodation
Renewable energy consumption (%)
Fishery production (tonnes)
Effective marine protected areas (km²)
Container volume handled per year (units)
Digital coverage, at least 4G (%)
Maritime connectivity index
Remoteness index
Cereal import dependency (%)
Mayotte
GDP structure
No data
GDP per capita : 9 678,97 (2024)
Unemployment rate : 37,00 (2023)
Gini index : 0,49 (2024)
Greenhouse gas emissions : nd
Tonnes of waste recycled : nd
Population growth (%)
Labour market dynamics
Employment rate % (Male)
Employment rate % (Female)
Unemployment rate
Youth labour force participation rate (%)
No data
GDP structure over time
No data
Circular economy (tonnes)
Domestic Extraction
Domestic Material Input
Domestic Material Consumption
Resources Productivity
Protected terrestrial areas (km²)
Eco-certified accommodation
No data
Renewable energy consumption (%)
No data
Fishery production (tonnes)
No data
Effective marine protected areas (km²)
Container volume handled per year (units)
Digital coverage, at least 4G (%)
No data
Maritime connectivity index
Remoteness index
Cereal import dependency (%)
No data
Reunion
GDP structure
No data
GDP per capita : 26,17 (2023)
Unemployment rate : 16,50 (2024)
Gini index : 0,36 (2024)
Greenhouse gas emissions : nd
Tonnes of waste recycled : nd
Population growth (%)
Labour market dynamics
Employment rate % (Male)
Employment rate % (Female)
Unemployment rate
Youth labour force participation rate (%)
GDP structure over time
No data
Circular economy (tonnes)
Domestic Extraction
Domestic Material Input
Domestic Material Consumption
Resources Productivity
Protected terrestrial areas (km²)
Eco-certified accommodation
Renewable energy consumption (%)
No data
Fishery production (tonnes)
No data
Effective marine protected areas (km²)
Container volume handled per year (units)
Digital coverage, at least 4G (%)
No data
Maritime connectivity index
Remoteness index
Cereal import dependency (%)
No data
Seychelles
GDP structure (2024)
GDP Agriculture
GDP Industry
GDP Service
GDP per capita : 17 858,82 (2024)
Unemployment rate : 4,30 (2020)
Gini index : 32,10 (2024)
Greenhouse gas emissions : 0,92 (2022)
Tonnes of waste recycled : 4 589,77 (2024)
Population growth (%)
Labour market dynamics
Employment rate % (Male)
Employment rate % (Female)
Unemployment rate
Youth labour force participation rate (%)
GDP structure over time
GDP Agriculture
GDP Industry
GDP Service
Circular economy (tonnes)
Domestic Extraction
Domestic Material Input
Domestic Material Consumption
Resources Productivity
Protected terrestrial areas (km²)
Eco-certified accommodation
Renewable energy consumption (%)
Fishery production (tonnes)
Effective marine protected areas (km²)
Container volume handled per year (units)
Digital coverage, at least 4G (%)
Maritime connectivity index
Remoteness index
Cereal import dependency (%)


